Search
In today’s fast-paced markets, staying ahead requires more than just intuition. Traders and analysts leverage custom indicators can unlock unique insights to decode price action and gauge momentum. By layering technical overlays directly onto price charts, you gain instant visual context for support, resistance, and volatility. This article dives deep into harnessing chart custom indicators with technical overlays, helping you build a robust, data-driven trading framework.
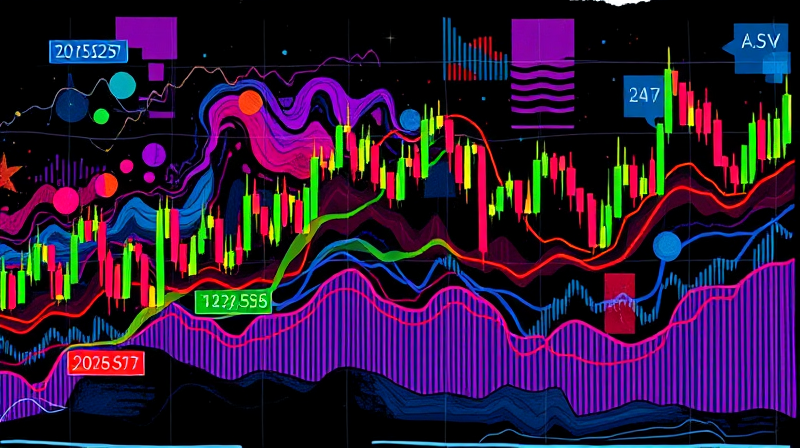
Technical indicators are mathematical formulas applied to price, volume, or open interest data. They serve as lenses, revealing hidden market patterns and potential trade signals. Overlays, on the other hand, are indicators drawn directly on the price chart. Think moving averages gliding over candlesticks or Bollinger Bands enveloping price swings.
By integrating overlays, you achieve real-time visual comparison of key data, enabling swift recognition of trends, reversals, and areas of consolidation. This direct overlay eliminates the need to scan separate indicator windows, ensuring you never miss a critical inflection point.
Relying on a single signal can lead to false alarms. Top traders blend multiple indicators, each offering a unique perspective:
This approach lets you filter noise and confirm signals across different analytical dimensions. For instance, a moving average crossover could signal the start of a trend, but adding an RSI confirmation helps validate strength and avoid false breakouts.
Standard tools may not address every strategy nuance. Custom indicators empower you to tailor inputs, algorithms, and visual outputs to your unique trading style. Follow these steps to transform an idea into a live trading tool:
Consider an adaptive divergence convergence (ADC) indicator. By refining standard MACD logic with dynamic smoothing factors, ADC reduces lag and improves entry precision. This exemplifies how tailored algorithms drive better trade timing.
Your choice of platform influences how easily you can build and deploy custom overlays. Here’s a comparative glance at popular solutions:
When selecting a platform, prioritize user-friendly coding interfaces and visual customization. Clear documentation and an active community can accelerate your development process.
Even the most sophisticated custom indicators can fail without disciplined execution. Adopt these best practices to maximize clarity and performance:
Visual clutter can obscure insights. Apply visual customization helps quickly interpret to highlight crucial signals. Keep charts lean by relying only on the most impactful overlays.
Charting custom indicators with technical overlays elevates your trading from guesswork to precision. By combining diverse indicators, crafting tailored algorithms, and selecting the right platform, you equip yourself with a data-driven framework for success. Remember to backtest diligently, avoid unnecessary tools, and fine-tune visuals. With these principles, you’ll transform raw market data into actionable insights and seize opportunities with confidence.
References