Search
In the ever-changing rhythm of financial markets, knowing when a trend ends can mean the difference between seizing profit and suffering loss. This guide walks you through powerful tools and patterns that act as your eyes and ears, helping you detect key support and resistance and capitalizing on the precise moment a reversal unfolds.
A market reversal occurs when the prevailing trend—up or down—loses momentum and the price embarks on a new, opposite trajectory. Unlike a mere pullback or correction, a reversal signals a complete shift in supply-and-demand dynamics.
Four essential elements make up a classic reversal pattern:
Detecting these shifts early provides traders with the opportunity to exit positions before sharp drawdowns or to enter fresh trades with tight risk management zones.
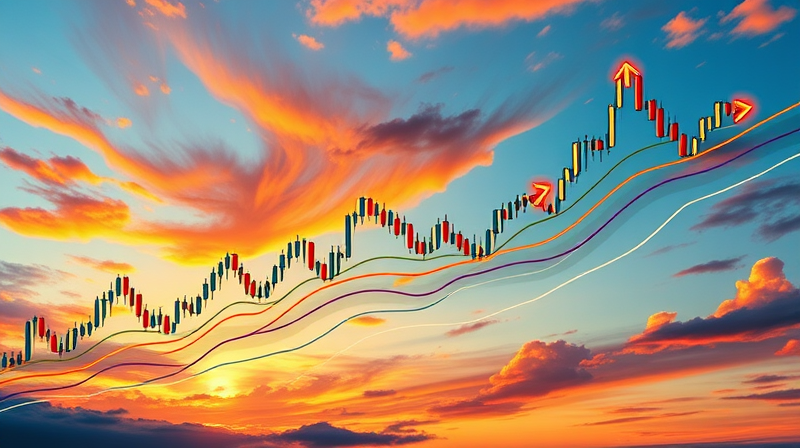
Candlestick formations often serve as early warning reversal systems, signaling exhaustion of one side and rising conviction for the other. They are most reliable when they appear on higher timeframes—daily or weekly—and at critical technical levels.
Below is a summary of key bullish and bearish candlestick signals:
Hammer: A small body perched atop a long lower wick. Sellers push price down, only for buyers to step in and close near the open. Confirmation requires a follow-up candle closing above the hammer’s high, ideally on higher-than-average volume.
Bullish Engulfing: A two-candle formation where a large bullish candle fully engulfs the preceding bearish candle. It shines most after an accelerated sell-off. Look for volume at least 150% of its recent average and oversold RSI readings for added conviction.
Morning Star: A three-bar structure—bearish candle, indecisive small body or Doji, then a strong bullish candle that penetrates deeply into the first. Volume should dwindle on the star and surge on the third candle, marking buyer dominance.
Shooting Star: Opposite of the inverted hammer, this candle has a small body near its low and a long upper wick. It signals seller resurgence at resistance. A bearish follow-through candle, especially with overbought RSI conditions, confirms the reversal.
Bearish Engulfing: After an upswing, a large red candle engulfs the prior green candle’s body. Ideal volume expansion and spot-on location at a known resistance level strengthen its reliability.
Evening Star: The bearish counterpart to the Morning Star. A long bullish candle, an indecisive middle candle, and a powerful bearish candle close the formation. Watch for a closure below the midpoint of the first candle and rising volume on the third.
Beyond individual bars, multi-bar patterns reveal structural shifts in market psychology. They often carry strong implications when confirmed by volume and momentum indicators.
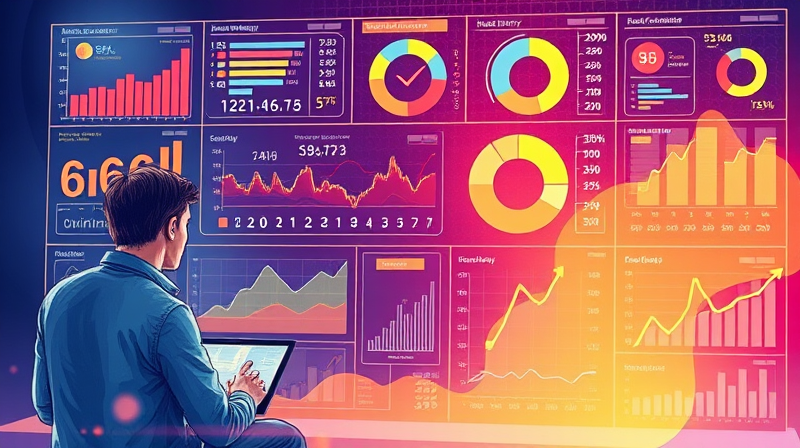
Momentum oscillators and trend indicators can corroborate price patterns or serve as standalone signals when divergence appears.
Integrating these with candlestick or chart patterns builds a robust confirmation process, reducing false signals and emotional overtrading tendencies.
Volume acts as the lifeblood of confirmations. Sharp spikes at pattern breakouts or volume divergence—where price rises but volume falls—can both highlight reversals.
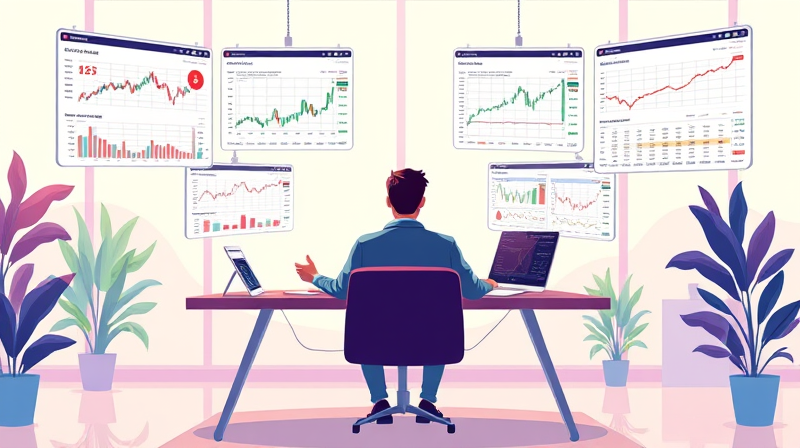
Modern traders also leverage hybrid tools and scripts that automatically detect complex formations in real time. These pattern scanners can be configured to alert on:
While automation speeds detection, always apply human judgment to assess context and market conditions.
Reversals mark critical turning points. Mastering their detection equips you to exit existing trades at peak profit, flip your bias in sync with shifting sentiment, and enter new positions with favorable risk-to-reward ratios.
By weaving together price-action insights, momentum readings, volume analysis, and advanced scanners, you’ll build a multifaceted toolkit. Each element reinforces the others, guiding you toward confident, disciplined decisions in the high-stakes realm of market turnarounds.
Embrace these reversal pattern detectors, practice them diligently, and watch as your trading transforms from reactive to proactive—ready to ride the next wave when the market inevitably turns.
References