Search
Managing a diverse portfolio of projects, investments, or assets in today’s fast-paced landscape demands instant, actionable business insights. Without the right visibility, critical opportunities and emerging risks can be overlooked, leading to missed targets and inefficient resource use.
Traditional static reports often arrive too late, leaving decision-makers reacting rather than planning. In contrast, real-time dashboards enable teams to respond to changing conditions immediately, turning raw data into strategic advantage and fostering data-driven decision making with confidence.
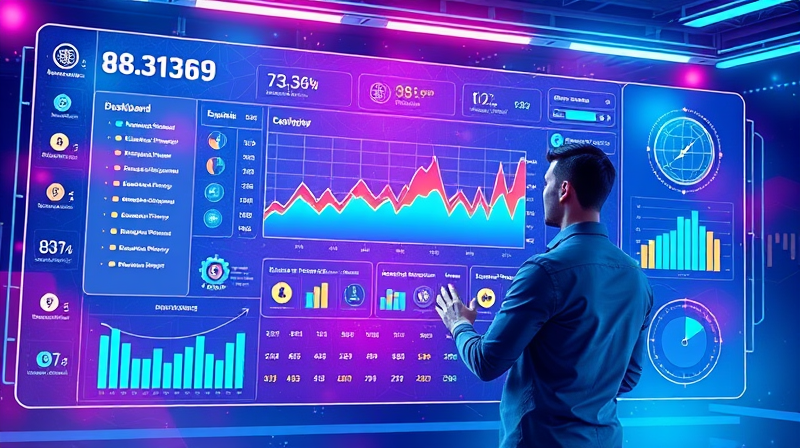
A real-time portfolio dashboard is a visual, interactive control center that aggregates information from multiple sources to provide a holistic, up-to-the-minute view of asset performance, resource allocation, and risk factors. These dashboards display live key performance indicators (KPIs) and metrics that update seamlessly as new data flows in.
By consolidating financial figures, operational statuses, and schedule milestones in one place, stakeholders gain a comprehensive overview of all operations, whether they manage property portfolios, software development sprints, or server clusters.
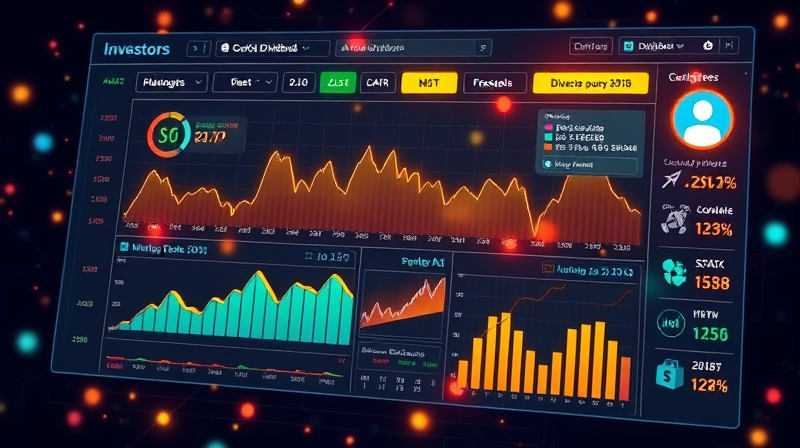
Real-time dashboards distinguish themselves through several essential capabilities that ensure flexibility, clarity, and depth of insight:
Whether you’re tracking cash flow projections or Kubernetes cluster health, these features transform raw figures into strategic narratives.
Choosing the right KPIs ensures your dashboard delivers clear, actionable insights without overwhelming users. Key categories include:
By balancing high-level indicators with drill-down options, you maintain clarity while empowering granular analysis.
Launching a real-time portfolio dashboard involves several critical steps to ensure relevance and effectiveness:
This approach ensures your dashboard remains an agile tool for continuous improvement, not a static report that grows outdated.
Different industries leverage real-time dashboards to solve unique challenges:
Real Estate: Portfolio dashboards aggregate property values, cash flow projections, occupancy rates, and maintenance costs, enabling investors to rebalance holdings and optimize returns.
Project Management: Multi-project interfaces track start/end dates, budgets, SPI, and EV, highlighting which initiatives are ahead of schedule or require immediate attention.
Knowledge Management: Role-based dashboards for editors, supervisors, and analysts track article confirmation rates, search usage, feedback loops, and backlog volumes to streamline publishing workflows.
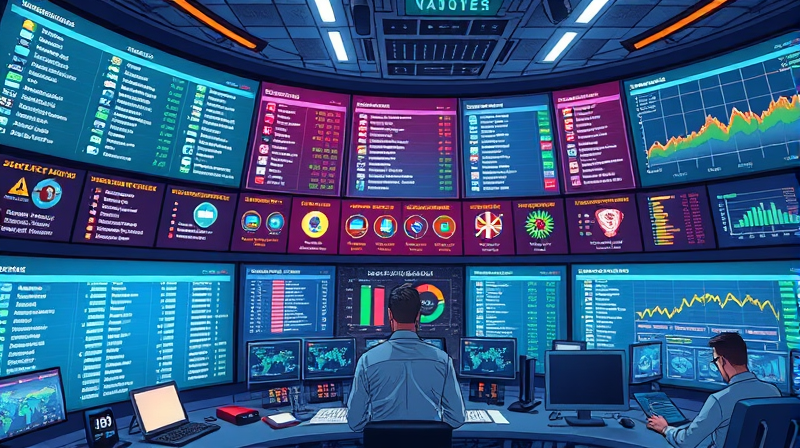
IT & Infrastructure: Real-time monitoring of server clusters, network traffic, and resource utilization provides early warnings on performance bottlenecks and security anomalies.
Implementing a dashboard comes with pitfalls that can undermine its value if not addressed:
Avoid overwhelming users with too many metrics. Start with high-level indicators and enable drill-downs for deeper context. Be prepared to tweak definitions as strategies evolve, and ensure tight security and reliable integrations for sensitive data.
Organizations that embrace continuous, real-time monitoring unlock several benefits:
Faster, evidence-based decisions; optimized resource allocation; improved bench-marking against industry standards; and early detection of inefficiencies or cost centers. This leads to greater alignment with strategic goals and sustained portfolio growth.
By shifting from periodic reviews to live tracking, teams develop the agility to seize opportunities and mitigate threats the moment they appear.
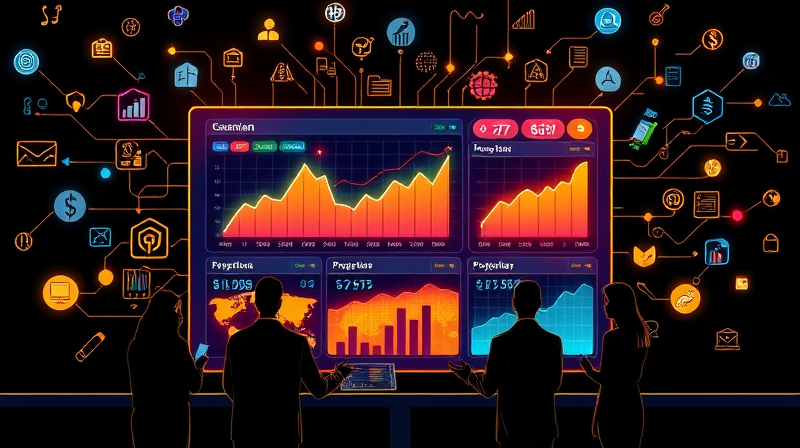
Real-time dashboards represent a paradigm shift in portfolio management. They transform disparate data into a unified, dynamic story of performance, risk, and opportunity. By adopting these tools and following best practices, you empower your organization to make data-driven decision making with confidence, streamline operations, and chart a clear path toward sustained growth.
Embrace the power of live metrics and watch your portfolio flourish in an ever-changing world.
References