Search
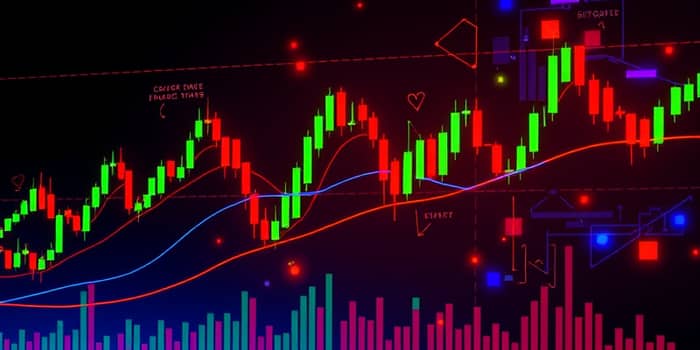
In the fast-paced world of financial markets, traders must make split-second decisions with confidence and clarity. Interactive charting platforms, equipped with a diverse suite of drawing tools, bridge the gap between raw data and actionable insight.
By harnessing these tools, market participants can transform chaotic price movements into coherent patterns, unlocking opportunities that lead to consistent, disciplined trading.
Technical analysis relies on the study of past price and volume data to anticipate future market moves. At its core, it is a visual discipline: drawing tools allow traders to overlay trendlines, highlight price zones, and annotate timeframes, making complex data instantly graspable.
In turbulent markets, emotions often cloud judgment. A well-structured chart, annotated with support and resistance levels, acts as a compass, guiding traders through uncertainty. This structured visual framework mitigates impulse-driven errors and fosters a patient, methodical approach.
Moreover, the precision these tools offer is crucial. Accurately placing lines at exact price and time coordinates enhances entries and exits, ensuring trades are executed at the intended levels. When every tick matters, real-time, high-fidelity annotations can be the difference between profit and loss.
Finally, drawing tools serve as a universal language among traders. Sharing annotated charts fosters collaboration, education, and community engagement. Whether you are explaining a strategy to colleagues or reviewing past trades in your journal, these visual cues create clarity and alignment.
Charting platforms offer a robust collection of tools that cater to diverse analytical needs. We can group these into four main categories, each serving a unique purpose in the trader’s toolkit:
Line tools are the bread and butter of technical annotation. Their simplicity belies their power:
Adopting a disciplined color scheme—for instance, blue for trendlines and red for support levels—enhances visual consistency and speeds up pattern recognition.
Fibonacci tools tap into the market’s natural rhythm, grounded in mathematical ratios found across nature and finance.
Fibonacci Retracement plots horizontal levels at key percentages—23.6%, 38.2%, 50.0%, 61.8%, and 78.6%—between swing highs and lows. These lines serve as likely pause or reversal zones after strong moves. Meanwhile, Fibonacci Extension projects beyond the initial swing, offering profit targets at 127.2%, 161.8%, and higher.
Fibonacci Arc draws curved lines centered at the second control point, creating dynamic support and resistance in both price and time dimensions. Traders often use arcs to anticipate cyclic turning points where momentum might shift.
Similarly, Fibonacci Fans and Time Zones deliver angled and vertical markers respectively, guiding traders through complex market structures and time-based cycles.
Beyond lines, geometric shapes provide a broader canvas for marking market patterns.
Rectangles or boxes are used to highlight consolidation ranges, where price moves sideways before a breakout. Recognizing these zones early allows traders to prepare for potential entry points when price escapes the box.
Ellipses and circles can spotlight cyclical swing points or intricate regions in chart patterns. More advanced platforms even enable freeform polygons to trace complex formations like head-and-shoulders, wedges, or broadening patterns.
Applying semi-transparent fills to these shapes adds depth to charts while maintaining clarity of underlying price action.
As technology evolves, charting platforms introduce intelligent tools to reduce manual work.
Automated pattern detection features—like TrendSpider’s algorithmic trendline finder—scan charts in seconds to identify setups, freeing traders to focus on strategy instead of manual chart prep.
Different chart styles can amplify the strengths of drawing tools:
By aligning chart type with analytical goals, traders can leverage drawing tools more effectively and adapt to changing market conditions.
The choice of platform determines the range, performance, and collaborative features you can leverage.
TradingView shines with social connectivity and cloud syncing, making it ideal for retail traders. LightningChart is built for low-latency environments, supporting massive data streams for institutional desks.
Integrating drawing tools into a consistent workflow is key to success:
These habits foster discipline, helping traders maintain a clear and objective approach even in volatile markets.
Interactive drawing tools are indispensable for traders aiming to turn raw market data into a structured narrative. From basic trendlines to advanced Fibonacci arcs and automated pattern scans, each tool enhances a trader’s ability to read the market and execute with precision.
By thoughtfully combining line tools, geometric shapes, pattern-specific annotations, and leveraging the right chart type, traders can build a robust analytical framework. Regardless of experience level, embracing these tools can spark new insights and foster the discipline needed for long-term success.
Step into the world of interactive charting, master the art of visual analysis, and unlock the full potential of your trading strategy.
References