Search

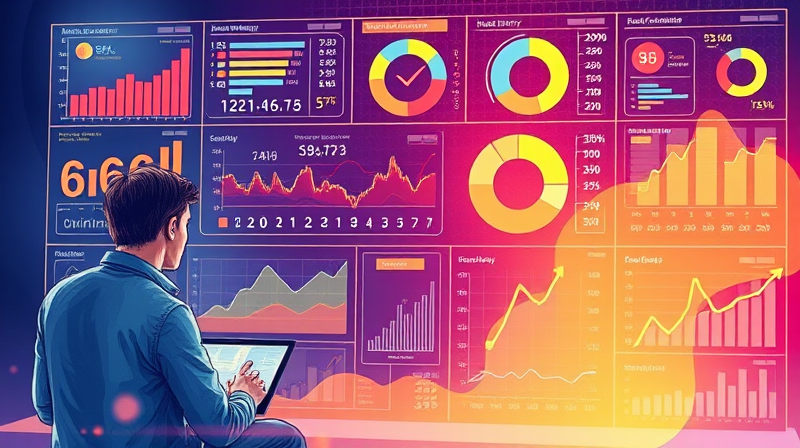
In today’s fast-paced markets, data is everywhere yet insight can be elusive. For traders, analysts and decision-makers, static tables and flat images no longer suffice. Interactive charts unlock a new dimension of understanding, enabling professionals to explore trends, react swiftly to changing conditions and anticipate shifts with confidence.
Whether you trade stocks on NYSE, futures on CME, forex pairs or crypto, the ability to pan, zoom and filter real-time data transforms raw numbers into compelling narratives. This article will journey through the world of interactive market visualizations, revealing platforms, features and best practices to help you harness these powerful tools effectively.
Interactive charts are dynamic visualizations that let users manipulate data directly on the canvas. Instead of static snapshots, you gain drill-down and filter capabilities, zooming into minute details or stepping back for a broad view.
By connecting to live feeds, these charts update continuously, translating volumes, quotes and trade sequences into patterns you can act on. The interactivity bridges the gap between raw market activity and strategic decisions, delivering actionable insights for traders in moments of volatility.
Different chart types highlight distinct aspects of market behavior. Choosing the right visualization is essential for clear, effective analysis.
Each format illuminates a different facet of trading—candles for momentum, depth graphs for liquidity, heat maps for concentration—enabling a holistic view of market dynamics.
Modern interactive charting platforms share a suite of essential capabilities. Zooming and dragging across timeframes lets you focus on micro trends or macro cycles. Real-time feeds feed new ticks directly into the chart, while customizable studies allow you to overlay indicators that suit your strategy.
Key features include:
These interactive functions help you spot entry and exit points faster, monitor risk thresholds and adapt to evolving conditions without switching interfaces.
Specialized platforms focus solely on financial markets, offering deep coverage, advanced indicators and professional-grade performance.
These platforms cater to different needs—from beginner-friendly free access to institutional-quality, low-latency feeds—ensuring every user finds the right balance of cost, data depth and functionality.
Beyond dedicated financial platforms, many enterprise BI and analytics tools adapt seamlessly to market data. By connecting to SQL databases, exchange APIs or Excel sheets, you can build interactive dashboards that combine trading metrics with broader business intelligence.
These general-purpose tools empower analysts and marketers to weave market metrics into cross-functional dashboards, fostering collaboration between trading, risk and business teams.
Deploying interactive charts effectively requires more than software—it demands disciplined workflows and clear objectives. Start by defining the key questions you need to answer: Are you monitoring liquidity shifts, analyzing sector performance or back-testing strategies?
Best practices include:
Incorporate AI-driven predictive analytics where available to surface patterns beyond human perception. Embrace mobile embedded analytics to retain flexibility, reacting to market moves anywhere, anytime.
Consider a commodity desk using live depth charts to anticipate large institutional orders on NYMEX, adjusting hedge positions in seconds. Or a crypto fund employing heat maps and scatter plots to uncover arbitrage opportunities across exchanges.
On the retail side, interactive candlestick patterns combined with RSI indicators can guide timely entries, while color-coded volume bars highlight unusual trading spikes for further research.
These success stories prove that when analysis is intuitive and interactive, decision-makers gain confidence, reduce reaction time and manage risk more effectively than ever before.
From real-time monitoring to historical back-testing, the journey toward more informed decisions begins with embracing the power of interactive charts. Let these visual tools illuminate hidden trends and empower you to navigate markets with clarity.
Empower smarter decisions today by exploring interactive market charting—transform data into insight, insight into action, and action into success.
References